Tropical Cyclone Wind Severity Map
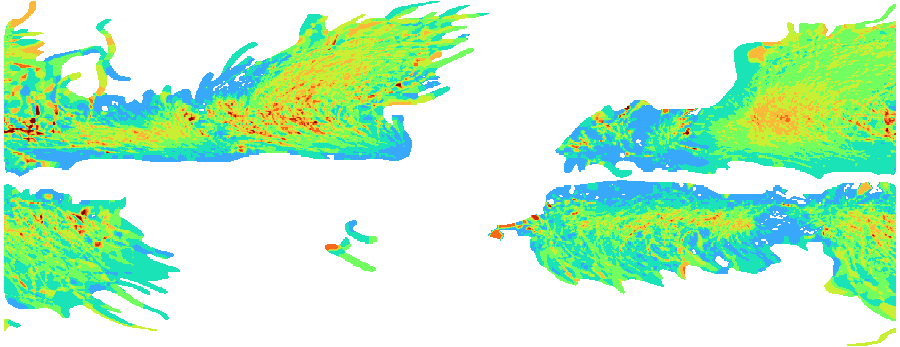
The Tropical Cyclone Wind Severity Map is a global raster dataset showing the maximum
wind speed recorded at each location from all historical tropical cyclone events
documented in the IBTrACS (International Best Track Archive for Climate Stewardship)
dataset maintained by NOAA NCEI. By aggregating the historical footprint of all tracked
storms into a single grid, this layer provides a globally consistent picture of peak
tropical cyclone wind exposure. It is valuable for property risk assessment, portfolio
screening, reinsurance modelling, and infrastructure design in cyclone-prone regions.
Data Visualisation
Technical information
Data coincides with the actual GeoNetwork catalog record - this is our most recent verified data.
| Coverage | Global |
| Data format | Raster (GeoTIFF) |
| Projection | EPSG:3857 (Web Mercator) |
| Resolution | ~10 km |
| Source | IBTrACS (NOAA) |
| License | Pending — not yet captured for this layer |
| Last updated | 2026-10-31 |
Interpreting the data
pixel values represent the maximum observed wind speed in knots
(1 kt ≈ 1.85 km/h) at each location across the full IBTrACS historical record, classified
from Light Wind (10–20 kt) through Tropical Storm and Severe Tropical Storm categories up
to Cyclone Category 3+ (≥ 90 kt). Areas with no recorded tropical cyclone activity carry
no data. The highest values are concentrated in the western Pacific (typhoon belt),
the Gulf of Mexico and Caribbean, the Bay of Bengal, and the southwestern Indian Ocean.
[colour ramp to be confirmed]
Resolution and update frequency
to be added. The dataset reflects the full historical IBTrACS record
and is updated periodically as new storm seasons are incorporated.
Source
https://www.ncei.noaa.gov/products/international-best-track-archive (NOAA NCEI — IBTrACS International Best Track Archive for Climate Stewardship). Public data; source acknowledgment recommended.
Related layers
| Layer | Why it's related |
|---|---|
| TODO | TODO |